

 Download files
 Verified to work with the
  To install the software needed to reproduce this system with the
 To set up the environment on the UCSF Wynton cluster to run
this system, run:
To set up the environment on the UCSF Wynton cluster to run
this system, run:
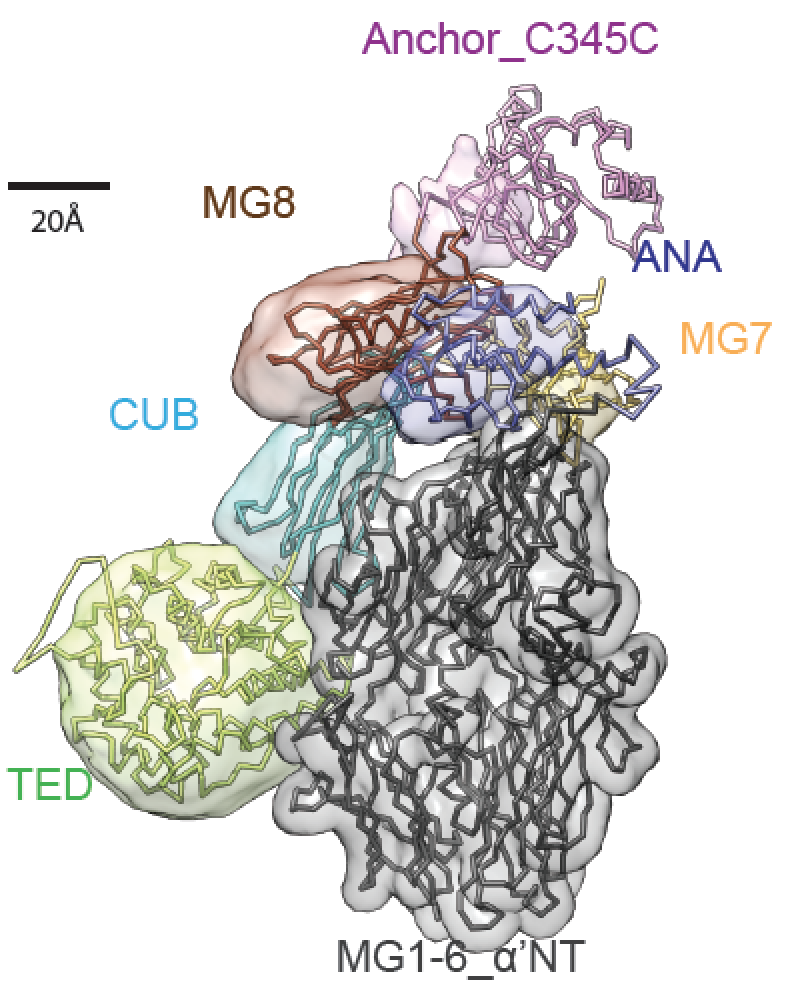
This repository contains the modeling files and the analysis related to the article "Structure of Complement C3(H2O) Revealed By Quantitative Cross-Linking/Mass Spectrometry And Modeling" by Zhuo A. Chen et al. in Molecular Cell Proteomics 2016. The directory structure is the following:
c3-template
c3b-template
ic3-template
c3-analysis
c3b-analysis
ic3-analysis
data
The directories are organized by system, thereby c3, c3b and ic3 correspond to the three different states of the complement, as discussed in the article.
template directories contain the
IMP
modeling.py script, which is run simply by
python modeling.py
on a single core and
mpirun -np 16 python modeling.py
on multiple cores (eg 16 in this case). The run produces files using the PMI PMI high-level interface. Refer to the IMP tutorial and Nup84 for fuller descriptions of the files.
analysis directories contain the scripts and the results of the analysis
on the actual production runs (which are available as traj-*.tar.xz
at Zenodo - note that two independent
runs were carried out for each state).
clustering.py is the first script that needs to be run. It produces directories with the corresponding structural cluster data. The output directory is kmeans_weight_0_500_1.
color_model.py assigns coded colors to a structure to finalize the image. The output file is colored.rmf3.
make_native_aligned.py aligns the cluster structures against a given X-ray structure.
plot_cross_links.py displays the box plot for the crosslinks. The output file is distances.pdf.
rmsd.py computes the root mean square distance of the cluster structures from the cluster center. The output file is rmsd.out.
rmsf_precision.py computes the root mean squared fluctuation of and the domain-wise precision of a cluster.
show_localization.py is a Chimera
session script to display the localization densities with the right threshold.
xl_matrix.py produces the contact map of the crosslinks; the output file is XL_table.pdf.
Author(s): Riccardo Pellarin
Date: August 2016
License: CC-BY-SA-4.0. This work is freely available under the terms of the Creative Commons Attribution-ShareAlike 4.0 International License.
Last known good IMP version:
Publications:
- Chen ZA, Pellarin R, Fischer L, Sali A, Nilges M, Barlow PN, Rappsilber J., Structure of Complement C3(H2O) Revealed By Quantitative Cross-Linking/Mass Spectrometry And Modeling, Mol Cell Proteomics, 2016, 10.1074/mcp.M115.056473.