


 Download files
 Verified to work with the
  To install the software needed to reproduce this system with the
 To set up the environment on the UCSF Wynton cluster to run
this system, run:
To set up the environment on the UCSF Wynton cluster to run
this system, run:
Benchmark for the sampling procedure used in the Mass Spec paper.
The method employs a custom MS connectivity restraint implemented in C++ within the open source IMP program. It is capable of sampling and evaluating candidate structures from information derived from connectivity information (e.g. native MS, cross-linking MS). The method exploits a Monte Carlo search followed by a conjugate gradients (CG) optimization step. From a large number of candidate model structures generated by sampling the conformational spaces of input structures (at the moment two input coordinate files are allowed), the algorithm gives a score (MS connectivity score) based on a Minimal Spanning Tree approach.
Each case in the benchmark is placed in its own directory (e.g. tAABC). The procedure is the same for each benchmark case; a number of Python scripts should be run in that directory. The assumption is made that IMP is already installed and is available in the Python path.
Models can be generated by running ms_cg.py.
This script first sets up the proteins in the system by calling create_protein. This takes two arguments, the name of the protein and the number of residues. For example, create_protein("ProteinA", 100) creates a protein called ProteinA containing 100 residues.
The connectivity restraint (IMP.core.MSConnectivityRestraint) is then set up. It is told how many copies of each protein are present by calling add_type. For example:
    iA = r.add_type([rps[0], rps[1], rps[2]]) # three copies of protein A
    iB = r.add_type([rps[3]]) # one copy of protein B
    iC = r.add_type([rps[4]]) # one copy of protein C
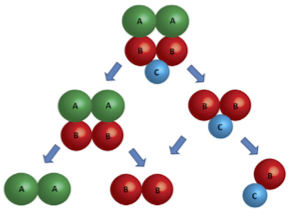
Next it is told the disassembly pathway of protein complexes by calling add_composite, for example:
    n1 = r.add_composite([iA, iB, iC, iD])
    n2 = r.add_composite([iA, iB, iC], n1)
    n3 = r.add_composite([iA, iB], n2)
    n4 = r.add_composite([iA, iC], n2)
    n5 = r.add_composite([iA, iB, iD], n1)
    n6 = r.add_composite([iB, iD], n5)
The above commands correspond to the disassembly pathway below: (todo)
The optimization can be tuned by editing the Python script. Common optimization parameters include the number of Monte Carlo steps, the number of conjugate gradient steps, and the number of models to generate. Generally speaking, more models should be generated for more topologically complex systems, or those containing many subunits.
The ms_cg.py script generates a number of structural models created by putting together the input proteins and their number of copies. Each model is named output/model/configuration.<number>.pym, and can be visualized in the PyMol program. The scores for each structure calculated using the MS connectivity restraint are output as output/scores.txt.
The script also generates clusters as output/model/cluster.<number>.pym, employing a k-means clustering approach. The number of clusters and the number of iterations used to generate them can be changed by editing the ms_cg.py script.
The algorithm can be benchmarked by measuring the closeness-of-fit between the structural models and known topologies. The first step is to convert the *.pym files into *.mfj. This can be done by first running the pym2tcl.py script and then the tcl2mfj.py script. These generate *.mfj files in the output/mfj directory.
Next, run the score_connect.py script which compares the topologies of structural models generated with the native-like topology usually obtained from the reference structure by scoring a) the interactions and b) the non-interactions. This means that if any interaction that exists in the reference structure is not found in the model, a penalty of 2.0 is added to this model. If, on the other hand, a non-existing interaction in the reference structure is found in the model, then the model receives a penalty of 1.0. The scores are summarized in the output file output/score-connect.txt.
Author(s): Argyris Politis, email: argyris.politis@kcl.ac.uk
Version: 1.0
License: LGPL. This library is free software; you can redistribute it and/or modify it under the terms of the GNU Lesser General Public License as published by the Free Software Foundation; either version 2 of the License, or (at your option) any later version.
Last known good IMP version:
Testable: Yes.
Parallelizeable: No
Publications:
- Keren Lasker, Javier A. Velazquez-Muriel, Benjamin M. Webb, Zheng Yang, Thomas E. Ferrin, Andrej Sali, Macromolecular assembly structures by comparative modeling and electron microscopy, Methods in Molecular Biology, 2011.
- Politis A, Stengel F, Hall Z, Hernandez H, Leitner A, Waltzhoeni T, Robinson CV, Aebersold R. A mass spectrometry-based hybrid method for structural modelling of protein complexes. Nature Methods, 11, 403-406, (2014)
- Hall Z, Politis A, Robinson CV. Structural modeling of heteromeric protein complexes from disassembly pathways and ion mobility-mass spectrometry Structure 20, 1-14, 2012.
- Politis A, Park AY, Hall Z, Ruotolo BT, Robinson CV.Integrative modelling coupled with ion mobility mass spectrometry reveals structural features of the clamp loader in complex with single-stranded DNA binding protein Journal of Molecular Biology 425, 4790-4801, 2013.